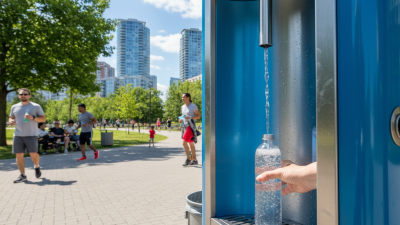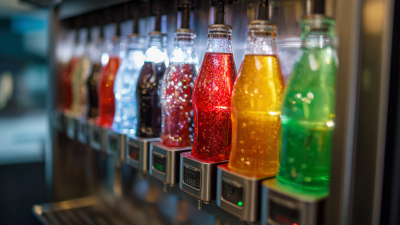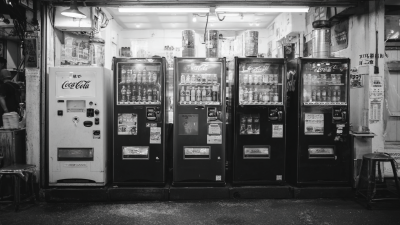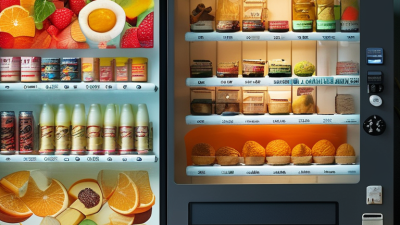
For many businesses, choosing a drink machine is a practical decision about access, speed, and customer experience. A well-placed unit can serve chilled water, coffee, juice, or specialty beverages without requiring a full service counter. Customers notice the details: a cold bottle after a workout, a warm coffee during an early shift, or a contactless payment screen that works immediately. Small moments matter.
Michael L. Kasavana, Ph.D., a respected vending and hospitality technology researcher, described vending as “retailing in its purest form.” That idea still fits today’s drink machine. It sells directly, records demand, and operates beyond traditional opening hours. For owners, the benefits may include lower staffing pressure, clearer inventory data, and better use of limited floor space. Yet the machine is not a magic solution. Poor placement, slow maintenance, or empty selections can quickly damage trust. That part is easy to underestimate.
A reliable drink machine should match the location, audience, and product strategy. A busy office may need compact coffee service. A gym may require hydration-focused options and frequent cleaning. A hotel may value quiet operation and premium presentation. Energy use also deserves attention. So does accessibility. Before purchasing, businesses should compare capacity, payment systems, sanitation features, refill schedules, warranty support, and total operating costs. The cheapest machine may become expensive when repairs interrupt sales. Good planning is less exciting, but more dependable. Even then, results can vary. Customer habits change, and the first product mix may need revision. That is not failure. It is useful evidence.
Why Choose a Drink Machine for Your Business?
Understanding Drink Machines in Modern Business
A drink machine can make beverage service more consistent during busy business hours. It measures portions, controls temperature, and reduces repeated manual tasks. In a café, office, hotel, or fitness center, this consistency matters. Customers notice when drinks taste different from one visit to the next.
The details are practical. A clear front panel helps customers choose quickly. Removable parts make daily cleaning easier. A machine with simple controls can reduce training time for new staff. Operators should record cleaning times, filter changes, and temperature checks. These records support safer routines and reveal problems before customers report them.
Maintenance still requires attention. It is not magic. A neglected machine can produce slow pours, unpleasant odors, or wasted ingredients. I have seen teams focus on sales numbers while overlooking small leaks and noisy pumps. That approach seems efficient, but it usually creates larger repair costs. Businesses should compare energy use, capacity, service access, and expected daily demand before buying. A machine that is too small may cause queues. One that is too large may waste space and ingredients.
Reliable operation also depends on clear staff responsibility. Someone should inspect the machine at opening and closing. Staff need instructions for cleaning, refilling, and reporting faults. Customers may enjoy faster service, but they also expect visible hygiene and accurate information about ingredients. Some choices are easy to miss. Recheck them regularly.
Before choosing a drink machine, measure how customers actually buy beverages. Review sales records by hour, season, and location. Watch the queue during lunch, when small delays become visible. A café near offices may need rapid coffee service. A gym may need chilled water, electrolyte drinks, or low-sugar options. Ask staff what customers request but cannot find. Their observations often reveal demand that spreadsheets miss. Keep the evidence current. A survey from last year may no longer describe today’s visitors.
Service capacity matters as much as product choice. Estimate cups or bottles served during the busiest thirty minutes. Then check refill speed, storage space, cleaning access, and power requirements. A machine that looks efficient can create bottlenecks if employees refill it constantly. Hygiene procedures should be clear, documented, and easy to follow. Staff need practical training, not just a manual. Test the workflow during a busy shift. It may feel slower than expected. That is useful information.
Consider customer expectations, too. Some want self-service and quick payment. Others need help with temperature, ingredients, or portion size. Accessibility should guide the machine’s height, controls, and surrounding space. Track waste, maintenance time, complaints, and repeat purchases after installation. Compare those results with the original forecast. Forecasts are rarely perfect. Cleaning time is easy to underestimate in busy locations. That oversight can affect service quality. Build room for adjustment before expanding the beverage program.
Choosing a drink machine starts with the service setting, not the machine’s appearance. Refrigerated vending machines suit offices, gyms, and waiting areas with packaged drinks. They offer sealed inventory, cashless payment, and remote stock alerts. Countertop dispensers work better in cafés or staff kitchens, where cups and refills are already managed. Post-mix systems provide adjustable portions and lower packaging waste, but they require water filtration, syrup storage, and frequent sanitation.
The choice affects operating costs. Grand View Research estimated the global vending machine market at about $21.8 billion in 2023, with technology and cashless payments supporting continued growth. NAMA’s 2022 State of the Industry report valued the U.S. convenience services market at approximately $26.7 billion. These figures suggest strong demand, but they do not guarantee profit for every location. Foot traffic still matters more than impressive specifications.
Core features deserve practical testing. Check cooling recovery after repeated door openings. Confirm whether telemetry reports temperature, sales, and faults in real time. For dispensers, inspect cleaning access, drip-tray removal, and filter replacement intervals. Energy use also deserves attention; a poorly insulated unit can quietly raise monthly costs. I have seen operators prioritize touchscreen menus while overlooking refill weight and service access. That is an expensive mistake. A simple machine may perform better, although it can feel less modern.
A drink machine can reduce service pressure, but its value depends on daily sales and operating costs. The National Restaurant Association’s 2024 industry report projected over $1 trillion in U.S. restaurant sales. It also highlighted continuing labor and food-cost pressure. A machine may help staff serve customers faster during busy periods. It cannot fix weak demand.
Energy use deserves careful attention. ENERGY STAR reports that certified refrigerated beverage vending machines can use about 40% less energy than standard models. That difference matters in a warm lobby or convenience area. Measure the machine’s wattage, monthly electricity rate, refill frequency, and average daily sales. For example, 35 drinks sold daily at a $1.20 gross margin create $42 before rent, maintenance, spoilage, and payment fees. The result may look attractive. Then a slow winter month changes the calculation.
Tips: Test the location for two weeks before buying. Track sales by hour, not just by day. Keep popular drinks at eye level, and inspect temperature, leaks, and payment functions each morning. Ask for written energy ratings and service costs. A cheaper machine may create more downtime. That is an easy mistake. Also, a drink machine needs cleaning, stock rotation, and accessible placement. These tasks take time, even when the machine appears automatic. Use conservative sales estimates, because optimistic forecasts often hide the real payback period.
| Business Metric | Staffed Beverage Counter | Standard Vending Machine | Refrigerated Smart Vending Kiosk | Countertop Self-Service Dispenser |
|---|---|---|---|---|
| Typical upfront equipment cost | US$15,000–US$60,000, excluding major construction and leasehold improvements | US$2,000–US$8,000 per machine | US$8,000–US$25,000 per kiosk | US$2,500–US$12,000 per unit |
| Installation and setup cost | US$10,000–US$100,000+, depending on plumbing, electrical work, counters, and permits | US$300–US$1,500 per location | US$1,000–US$5,000 per location | US$500–US$3,000 per location |
| Typical power consumption | Approximately 15–45 kWh per operating day, including refrigeration and beverage equipment | Approximately 3–8 kWh per day | Approximately 5–12 kWh per day | Approximately 2–7 kWh per day |
| Estimated monthly electricity cost | US$55–US$165, assuming US$0.12/kWh and 30 operating days | US$11–US$29 | US$18–US$43 | US$7–US$25 |
| Direct labor requirement | Typically 1 or more attendants during operating hours | Approximately 2–5 labor hours per week for restocking and collection | Approximately 3–7 labor hours per week for restocking, cleaning, and monitoring | Approximately 2–6 labor hours per week for replenishment and sanitation |
| Approximate service capacity | About 30–120 drinks per hour, depending on menu complexity and staffing | About 20–60 purchase transactions per hour | About 30–90 purchase transactions per hour | About 40–120 servings per hour, depending on product and payment flow |
| Operating availability | Usually limited to staffed opening hours | Can operate 16–24 hours per day with remote monitoring | Can operate 16–24 hours per day with digital payment and monitoring | Usually available during the host business’s opening hours |
| Product holding capacity | Flexible storage; capacity depends on back-of-house space and daily preparation | Approximately 150–500 packaged items, depending on machine configuration | Approximately 200–700 chilled or packaged items, depending on machine size | Typically 20–80 liters of ingredients or prepared beverage inputs |
| Typical transaction value | US$3.00–US$8.00 per beverage | US$1.50–US$4.00 per item or beverage | US$2.00–US$7.00 per item or beverage | US$1.50–US$5.00 per serving |
| Typical gross margin before fixed costs | Approximately 55%–75%, before labor, rent, utilities, and waste | Approximately 35%–55%, before location commission and maintenance | Approximately 40%–65%, before location commission, maintenance, and spoilage | Approximately 50%–75%, before ingredients, cleaning, labor, and payment fees |
| Payment processing cost | Generally 2.5%–3.5% of card or mobile transactions | Generally 2.5%–4.0% of cashless transactions | Generally 2.5%–4.0% of cashless transactions | Generally 2.5%–4.0% of cashless transactions |
| Restocking frequency | Multiple times per day during busy periods | Usually 1–3 times per week | Usually 2–5 times per week, depending on demand and perishability | Usually daily or every 2–3 days in high-traffic locations |
| Waste and spoilage risk | Moderate to high because of fresh ingredients and made-to-order preparation | Low for shelf-stable products; higher for chilled products nearing expiration | Moderate because of chilled inventory and expiration control | Low to moderate, depending on ingredient shelf life and cleaning procedures |
| Maintenance planning allowance | Approximately 3%–8% of equipment value per year, excluding major repairs | Approximately 5%–10% of equipment value per year | Approximately 6%–12% of equipment value per year | Approximately 4%–10% of equipment value per year |
| Illustrative monthly sales scenario | 80 drinks per day × US$5.00 × 26 days = US$10,400 | 25 sales per day × US$2.50 × 30 days = US$1,875 | 45 sales per day × US$4.00 × 30 days = US$5,400 | 60 servings per day × US$3.00 × 26 days = US$4,680 |
| Illustrative monthly gross profit | Approximately US$5,720–US$7,800 before fixed operating costs | Approximately US$656–US$1,031 before location fees and maintenance | Approximately US$2,160–US$3,510 before location fees and maintenance | Approximately US$2,340–US$3,510 before labor and cleaning |
| Potential payback period | Approximately 18–48 months, highly dependent on rent, labor, and sales volume | Approximately 12–30 months in a strong location | Approximately 18–36 months in a high-traffic location | Approximately 12–30 months when utilization is consistently high |
| Best fit for | Businesses seeking a broad menu and a high-touch customer experience | Offices, residential buildings, schools, and locations with steady packaged-product demand | Transport hubs, campuses, hospitals, offices, and other high-traffic sites | Gyms, hotels, offices, waiting areas, and existing food-service environments |
Planning note: Figures are realistic industry planning ranges in U.S. dollars, not guaranteed results. Actual costs and returns vary by location, electricity rates, product mix, labor rates, payment method, maintenance contract, local regulations, traffic volume, and operating schedule.
Choosing a drink machine starts with your business model, not the machine’s appearance.
A busy office needs reliable coffee, chilled water, and simple payment options. A gym may need larger bottles, low-sugar drinks, and fast service. A small hotel may value compact equipment more than maximum capacity. Match the machine to customer habits, opening hours, and available floor space.
Industry data supports careful planning. Grand View Research valued the global vending machine market at about US$21.3 billion in 2023. Its report also projects strong growth through 2030. In the United States, NAMA’s 2022 census reported approximately US$26.7 billion in convenience-services revenue for 2021.
These figures show demand, but they do not guarantee profit. Location still matters most.
Test the business model before making a large purchase.
Record daily foot traffic near the proposed machine. Measure sales by drink type, temperature, and time of day. Ask whether staff can refill products safely and clean the unit regularly. Energy use, payment fees, repairs, and spoilage can quietly reduce margins.
Choose flexible storage when demand is uncertain. A machine with remote stock alerts can reduce empty shelves, but only if someone responds quickly. According to ENERGY STAR guidance, efficient commercial equipment can lower operating costs, yet actual savings depend on usage and maintenance.